

Generally, when a spring goes dry, the cause is drought, groundwater production, or drought and groundwater production. In the case of Las Moras Springs, it’s most likely drought and groundwater production, and there are several lines of evidence to support this.
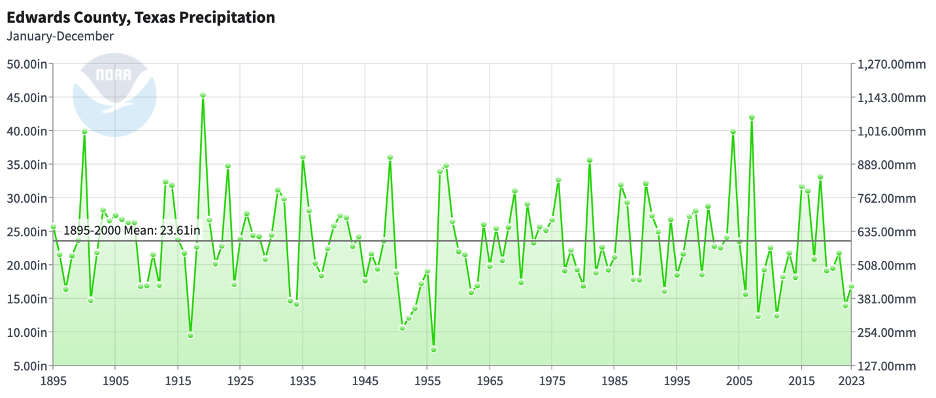
As I previously posted, Las Moras Springs first went dry in 1964. This is telling, because the springs readily survived the worst drought on record in the early 1950s. Figures 1 and 2 below show annual precipitation in Kinney and Edwards counties from 1895 through 2023. You can see that it ain’t been great rainfall-wise in either county since 2005: five years of above average rainfall and 13 years below average in Kinney County (and something similar in Edwards County). But you can also see that, in both counties, the drought in the early 1950s was worse. Also note how low precip got in the late aughts and earliest teens (2005 through 2011), far worse than anything we’ve seen since 2015. I’m showing both counties since a chunk of the water budget for the Edwards Aquifers in Kinney County sources from diffuse recharge in and underflow from Edwards County.

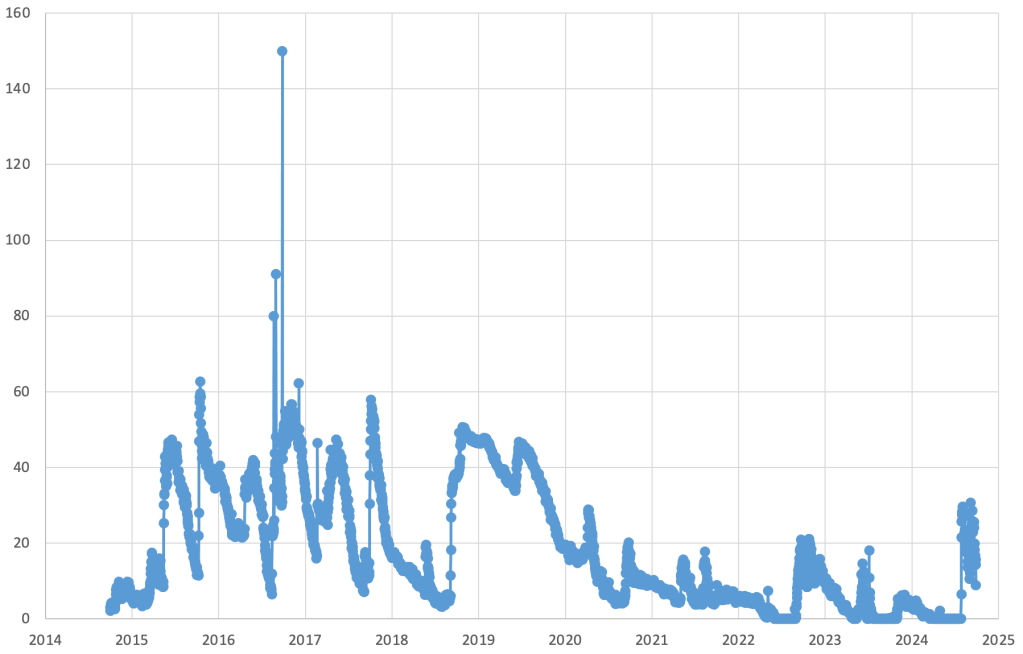
The next two figures show International Boundary Water Commission (IBWC) and U.S. Geological Survey (USGS) data. Unfortunately, there’s a gap between 2008 and late 2014. I am still waiting to hear back from IBWC on confirming their data, and I still need to poke USGS on why they don’t publicly post all their data for the springs.
The IBWC data shows the springs surviving the 1950s drought, going dry in 1964, and then failing or getting close to failing in 1967, 1971, 1972, 1977, 1980, and 1996 (my clandestine data source only shows the springs failing in 1967 and the springs not failing between 2008 and 2015). Comparing these last four years with the precipitation plots reveals that none of those years (1972, 1977, 1980, and 1996) had particularly low rainfall totals when compared to the drought of the 1950s.
Groundwater production during the 1950s was probably low since there was not a lot of irrigation with groundwater. However, Bennett and Sayre (1962) noted that windmills produced from most of the 200 “pumping” wells in the county at that time, amounting to about 2,000 acre-feet per year, and that free-flowing wells added another 2,000 acre-feet per year adding up to a total of 4,000 acre-feet per year (Sayre did not provide details on how he made his estimates). This seems high to me, especially given that later amounts of groundwater production are in this general ballpark. The windmill pumping seems on the high side to me: that’s about 6 gallons per minute of flow 24/7/365. I’m reading that 3 gallons per minute is typical for a windmill, so perhaps that’s 1,000 acre-feet per year for a total of 3,000 acre-feet per year. The flow from the free-flowing wells also seems on the high side (and would have declined during droughts). Regardless, the springs did not go dry during the 1950s.
The springs did go dry in 1964, and multiple sources point to irrigation production in addition to drought. This is not a crazy thought because the drought for 1963-64 was less intense than the drought for 1950-56. So what changed? In this case, pumping.
I mentioned a couple newspaper articles in my other post about the possible cause of the springs going dry, but Garza (1966), a U.S. Geological Survey scientist writing in a Texas Water Development Board report, stated that “Two main factors–the increased irrigation development, west and southwest of Brackettville, and a relatively dry season–brought about abnormally low water levels in the summer of 1964. The water level in well V-6 dropped more than 20 feet and Las Moras Springs ceased to flow during this period. After the pumping decreased in the fall and winter, the levels and spring flow recovered.” Garza (1966) goes on to state that “This situation can be expected to recur, and if the irrigation development continues to increase, the springs may cease flowing for longer periods.”

Let’s focus on the recent past to see what we can learn. Years 2006, 2008, 2009, and 2011 were all dry years (Figures 1 and 2). Unfortunately, I don’t have data from 2008 through late 2014, but springflow dropped, but did not fail, in 2006 and 2008. However, we saw the springs fail in 2022, 2023, and 2024 with low rainfall, but nothing as low as 2006 and 2008. What changed?
Figure 5 is a graph from a letter report by Bill Hutchison, the Kinney County Groundwater Conservation District’s hydrologic consultant, showing pumping estimates from 1995 through 2023 (Hutchison 2024). Do you see what I see? That’s a heck of an increase in pumping for 2022, 2023, and 2024. Hutchison (2024) notes that “Because of persistently dry conditions, low spring flow is expected.” and “…it is reasonable to conclude that groundwater pumping has contributed to the lower-than-expected spring flow and the non-achievement of the [Groundwater Management Area] 7 [desired future condition] in 2023.”

Hutchison (2024) goes on to explore what might be affecting groundwater pumping for irrigation, noting that “Studies are ongoing to better characterize the nature of the connection between pumping and spring flow variation, including improving the understanding of which wells contribute to spring flow decline.”
Hutchison (2024) shows that, based on satellite analysis (nice!), irrigated acreage has fluctuated from about 1,000 acres to close to 4,000 acres between 1995 and 2022 (FIgure 6). He concludes that “there has been no long-term increase in irrigated acreage since 1995, and 2022 irrigated acreage does not represent the maximum.” He then notes that is has been dang dry (my words) since 2019.

But it has also been dang hot. Hutchison (2024) shows the increase in gross evaporation rate (what the evaporation rate would be if there were water to evaporate; Figure 7). Yikes. In other words, irrigated fields need more water to stay in the same place agriculturally, hence the increase in pumping.
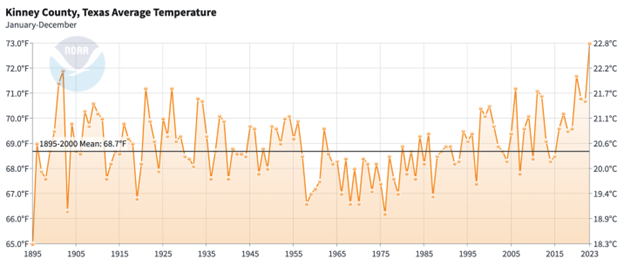
This rise in gross evaporation rate corresponds with a pronounced rise in temperature in both counties (Figures 8 and 9) as well as with a decline in flows in the West Nueces River near Brackettville, which is surely due to a combination of reduced rainfall and increased temperature leading to less run off (Figure 10). These increases in temperature and evaporation and decreases in runoff raise the specter (just in time for All Hallow’s Eve!) of climate change as another driver influencing springflows, directly through decreased recharge (diffuse and direct) and indirectly through increased pumping. These temperature and run-off trends do not bode well for the future of flows, at least not without a management intervention.


My understanding is that the connection between springflow and groundwater pumping is controversial in the county. I’m not sure why. There’s a lot of evidence to support the connection from a variety of experts, and the recent increase in pumping seems quite definitive, especially when we compare recent years with the ~2005 to 2012 time period when the rainfall deficits were much larger, almost allowing “controlled experiments” on the aquifer. Even the groundwater district’s hydrologist recognizes the connection. Does it need more study? Yep. The details of which areas and wells are having an impact are important. But we should also keep an eye on the broader climatic trends.
REFERENCES
Bennett, R.R., and Sayre, A.N., 1962, Geology and ground-water resources of Kinney County Texas: Texas Water Commission, Bulletin 6216, 141 p.
Garza, S., 1966, Ground-water resources of the San Antonio Area, Texas—A progress report on studies, 1960-64: Texas Water Development Board (prepared by the U.S. Geological Survey), Report 34, 31 p.
Hutchison, W.R., 2024, Comparisons of actual data and desired future conditions for 2023–Las Moras Spring Flow and Well 70-38-902: letter to Genell Hobbs, General Manager, Kinney County Groundwater Conservation District, dated June 3, 2024.
LBG-GA (LBG-Guyton and Associates), 2010, Groundwaer data acquisition in Edwards, Kinney, and Val Verde counties, Texas: prepared for the Plateau Region Water Planning Group and Texas Water Development Board, July 2009 revised March 2010, 105 p.
NCEI (National Centers for Environmental Information), 2024, Climate at a Glance—County time series: published October 2024, retrieved on October 27, 2024 from https://www.ncei.noaa.gov/access/monitoring/climate-at-a-glance/county/time-series

Thank you for your take on our beloved Las Moras Spring(s). I guess I should refer to it in the plural because it is a *group *of springs, but I probably won’t. Muscle memory on the keyboard. Eek to the temperature graphs. I did move here for the heat but hell. Thanks again. A link to this goes on my substack, followed by a trip to facebook.
LikeLike