


Things have been looking a bit grim lately in Comal and San Marcos springs. Comal Springs has bottomed out at its fourth lowest flow rate since 1927 during this drought (Figure 1) with San Marcos Springs experiencing its third lowest flow since 1956 (Figure 2). With reports of the upper Guadalupe River, the Highland Lakes, and the Nueces River Basin possibly experiencing new droughts of record, it begs the question: Is the San Antonio Segment of the Edwards Aquifer experiencing a new drought of record?
You might be thinking “No” because springflows have not reached record lows. However, springflows and lake levels are controlled not only by droughts, but also by use and management. So the fact that the flows are not at their lowest doesn’t necessarily mean that an aquifer, river, or lake is not experiencing a new drought of record.
Establishing if there’s a new drought of record requires modeling to ensure that each drought is treated the same way to get a dried apples to dried apples comparison. Unfortunately, this is not easy and is generally not done until a drought is completely over. And it’s generally not done for aquifers (but probably would be done for the Edwards Aquifer if the model-keepers thought we had experienced a new drought).
I’m not gonna run the model (my multi-year sentence in upper management dried up most of those hands-on skills); however, in the case of the Edwards Aquifer, we can get a clue by looking at the data to see if it suggests this current drought is in drought-of-record territory. I did this by looking at readily available average annual recharge data since 1927 calculated by the U.S. Geological Survey and provided in annual summary reports by the Edwards Aquifer Authority.
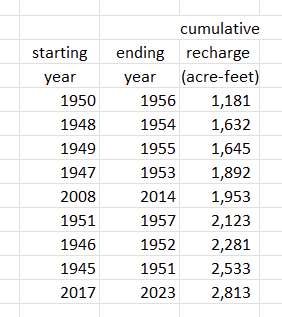
I compared the current drought to past droughts by comparing cumulative annual recharge volumes over time. Since the 1950s drought (the drought generally recognized as the drought of record) lasted 7 years, I first looked at 7-year totals of recharge. For each year of record (barring the first six years), I calculated the seven-year sums of recharge to and through that year for each year ranging from 1940 through 2023.
The lowest total came in at 1,181,000 acre-feet for 1950 through 1956 while the most recent 7 years (2017 through 2023) came in ninth at 2,813,000 acre-feet (Table 1). Seven of the 9 worst 7-year recharge totals end in the 1950s. It’s also interesting to note that 1945 through 1951, which includes 5 years preceding the lowest recharge total, was “drier” than the previous 7 years of the current drought. Outside of the 1950s, the 2008 through 2014 period had 30 percent less recharge than the current drought.
This analysis doesn’t prove anything–there’s more to a drought of record than 7-year annual recharge totals, but helps to put things into context.
In addition, the drought is still going, and we don’t have 2024 numbers yet. If 2024 looks like 2023, the current drought will come in at 8th place instead of the current 9th. If 2024 and 2025 look like 2023, the current drought jumps to 2nd place. The reason for that big jump to second place is that 2018 was a high-recharge year with 1,100,000 acre-feet, twice the median annual recharge rate. If instead of a 7-year duration we look at a 5-year duration (to avoid that gloriously way-above-average year), the current drought jumps to 4th place with 1st through 3rd occurring during the 1950s. By that measure, the current 5-year drought is the worst since the 1950s. The lowest 5-year recharge total occurred from 1952 through 1956 with about 70 percent of the current 5-year drought’s total.

Do you think the 10-year rolling average (<500,00 acre feet of recharge) trigger for the 50,000 acre ft forbearance of Edwards water (ASR in current permit), should use a shorter time period – for example 7- or 5-years to avoid the dwindling long term effects of single large recharge years?
LikeLike