

I just got back from from an Implementing Committee meeting on the habitat conservation plan for the Edwards Aquifer (the part under the jurisdiction of the the Edwards Aquifer Authority). Chad Furl gave us an update on springflows and water levels, and it wasn’t pretty. The last time I gawked at flows at San Marcos Springs, they were popping at 100 cubic feet per second, quite a bit below the long-term average of about 152 cubic feet per second. However, Dr. Furl noted that flows as of today were about 83 cubic feet per second. Comal Springs came in lower at a dismal 71 cubic feet per second as compared to a long-term average of 284 cubic feet per second.
Because Comal Springs are usually the largest spring system in the state, that makes San Marcos Springs the largest in the state, at least for the time being. I looked around city hall in New Braunfels, home of Comal Springs, but didn’t see a trophy to claim for this biggest-spring honor (and I’m too humble to ask). When these flow switcharoos occur, it’s an indication of an aquifer under stress from pumping and drought.
Last year about this time we got down to 67 cubic feet per second at San Marcos Springs, which was the lowest since 1956. The last time flows at San Marcos were lower than this current drought was in 1984 when flows bottomed out at 64 cubic feet per second. The lowest flow measured at the springs was 46 cubic feet per second in August 1956.

Comal Springs was also lower last year, sinking to 55 cubic feet per second in August. The current drought is the worst one since 1990 when flows dropped to 46 cubic feet per second. Comal Springs recorded no flow for 144 days in 1956 from June through November. Note that I wrote “recorded no flow;” the springs did not go dry since there was still water in the lake (something Charlie Kreitler pounded into my head from back in my EARIP Science Committee days).
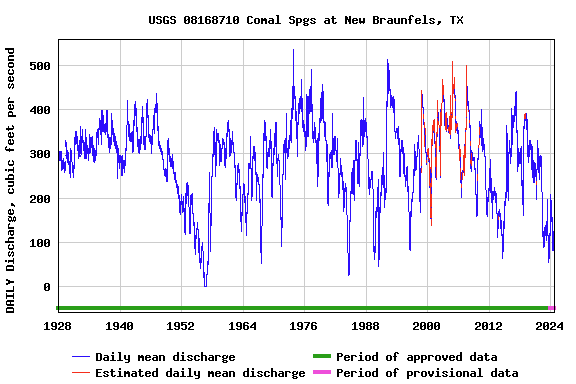
Something I noticed a couple months ago with the Comal Springs hydrograph above is (1) how the record started in late 1927 and (2) the relative stability of springflows before 1950 as compared to springflows during and after the 1950s when groundwater production ballooned. This suggests that the amplitude of springflow variations increased two to four times due to pumping.
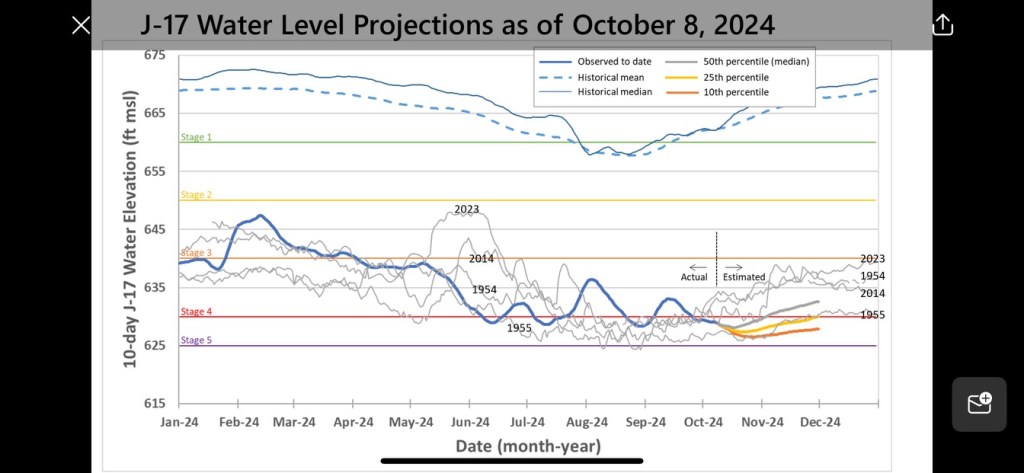
Statistical three-month projections shows what might happen at the 10th, 25th, and 50th (median) percentiles. With a La Nina favored for the fall, drier conditions are expected, so the 10th and 25th percentiles are more likely, suggesting Stage 4 drought conditions through at least the end of the year. Perhaps the anticipated weak La Nina will allow a few showers to get through. We certainly need ’em.


I’d like to keep putting links to your stories through my substack if you don’t mind. I like the ones about how groundwater production affects springflow….
Carolea
LikeLike
I don’t mind at all. Thank you for asking.
LikeLike